What is an EWMA Chart? The EWMA chart (Exponentially-Weighted Moving Average Chart) is a control chart monitoring the exponentially-weighted average of previous and present subgroup means. The more recent data get more weight than older data. It detects the shift of the process mean from the process target over time. The underlying distribution of the […]
Tag Archives | control chart
CumSum Chart with Minitab
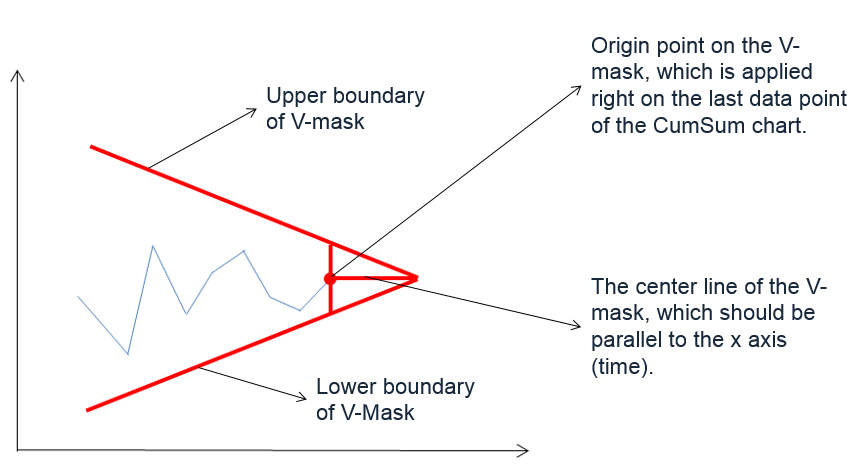
What is a CumSum Chart? The CumSum chart (also called cumulative sum control chart or CUSUM chart) is a control chart of monitoring the cumulative sum of the subgroup mean deviations from the process target. It detects the shift of the process mean from the process target over time. The underlying distribution of the CuSum […]
NP Chart with Minitab
What is a NP Chart? The NP chart is a control chart monitoring the count of defectives. It plots the number of defectives in one subgroup as a data point. The subgroup size of the NP-chart is constant. The underlying distribution of this control chart is binomial distribution. NP Chart Equations NP-chart Data Point: Center […]
Xbar S Chart with Minitab
What is a Xbar S Chart? The X-S chart (also called Xbar S chart) is a control chart for continuous data with a constant subgroup size greater than ten. The Xbar chart plots the average of a subgroup as a data point. The S chart plots the standard deviation within a subgroup as a data […]
IR Chart with Minitab
What is an IR Chart? The IR chart (also called individual-moving range chart or I-MR chart) is a popular control chart for continuous data with subgroup size equal to one. If there are n data points in the I chart, there are n –1 data points in the MR chart. The I chart is valid […]
Run Chart with Minitab
Why we use a Run Chart A run chart is a chart used to present data in time order. These charts capture process performance over time. The X axis indicates time and the Y axis shows the observed values. A run chart is similar to a scatter plot in that it shows the relationship between X and […]