Top Nav

Tag Archives | SigmaXL

Stepwise Regression in Minitab

Stepwise Regression in Minitab

What is Stepwise Regression? Stepwise regression is a statistical method to automatically select regression models with the best sets of predictive variables from a large set of potential variables. There are different statistical methods used in stepwise regression to evaluate the potential variables in the model: Three Approaches to Stepwise Regression How to Use Minitab […]

Continue Reading
Kruskal Wallis SXL_00

Kruskal Wallis Test with SigmaXL

Kruskal–Wallis One-Way Analysis of Variance The Kruskal Wallis one-way analysis of variance is a statistical hypothesis test to compare the medians among more than two groups. Null Hypothesis (H0): η1 = η2 = … = ηk Alternative Hypothesis (Ha): at least one of the medians is different from others. Where: ηi is the median of […]

Continue Reading
Mann Whitney SXL_00

Mann Whitney testing with SigmaXL

What is the Mann Whitney Test? The Mann Whitney test (also called Mann–Whitney U test or Wilcoxon rank-sum test) is a statistical hypothesis test to compare the medians of two populations that are not normally distributed. In a non-normal distribution, the median is the better representation of the center of the distribution. Null Hypothesis (H0): […]

Continue Reading
One Way ANOVA SXL_01

One Way ANOVA with Sigma XL

What is One Way ANOVA? One way Analysis of Variance is a statistical method to compare means of two or more populations. It is a generalized form of the two sample t-test since a two sample t-test compares two population means and one way ANOVA compares k population means where k ≥ 2. Null Hypothesis (H0): μ_1=μ_2=…=μ_k […]

Continue Reading
Two sample t Test SXL_01

Two Sample t Test with SigmaXL

Two Sample t Test Two sample t test is a hypothesis test to study whether there is a statistically significant difference between the means of two populations. Null Hypothesis (H0): μ1 = μ2 Alternative Hypothesis (Ha): μ1 ≠ μ2 Where: μ1 is the mean of one population and μ2 is the mean of the other […]

Continue Reading
Central Limit Theorem SXL_01

Central Limit Theorem with SigmaXL

Central Limit Theorem The Central Limit Theorem is one of the fundamental theorems of probability theory. It states a condition under which the mean of a large number of independent and identically-distributed random variables, each of which has a finite mean and variance, would be approximately normally distributed. Let us assume Y1, Y2 . . […]

Continue Reading
Capability Analysis SXL_01

Capability Analysis with SigmaXL

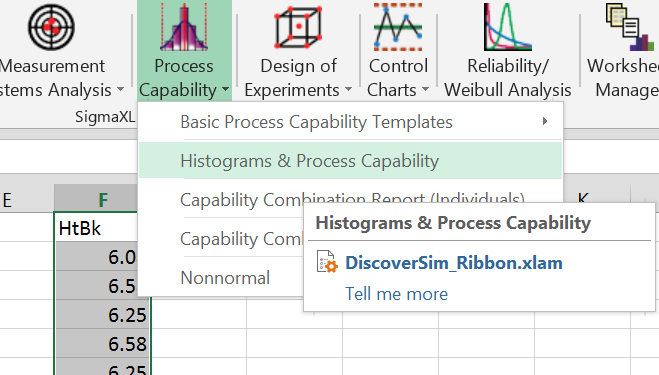
Process Capability Process capability measures how well the process performs to meet given specified outcome. It indicates the conformance of a process to meet given requirements or specifications. Capability analysis helps to better understand the performance of the process with respect to meeting customer’s specifications and identify the process improvement opportunities. Process Capability Analysis Steps […]

Continue Reading
RunChart SXL_01

Run Chart with SigmaXL

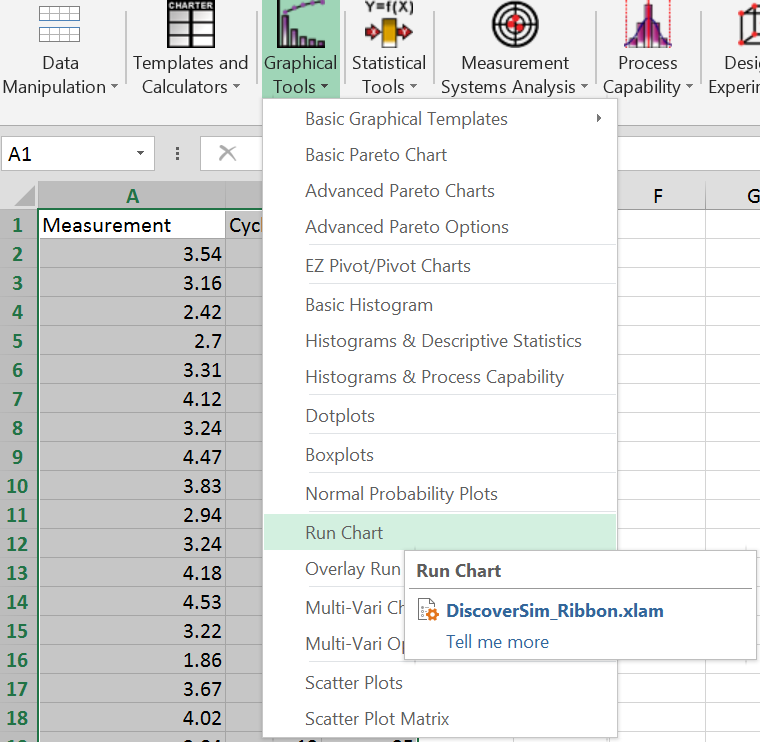
Why we use a Run Chart A run chart is a chart used to present data in time order. These charts capture process performance over time. The X axis   indicates time and the Y axis shows the observed values. A run chart is similar to a scatter plot in that it shows the relationship between X […]

Continue Reading
Multi Vari Analysis SXL_01

Multi Vari Analysis with SigmaXL

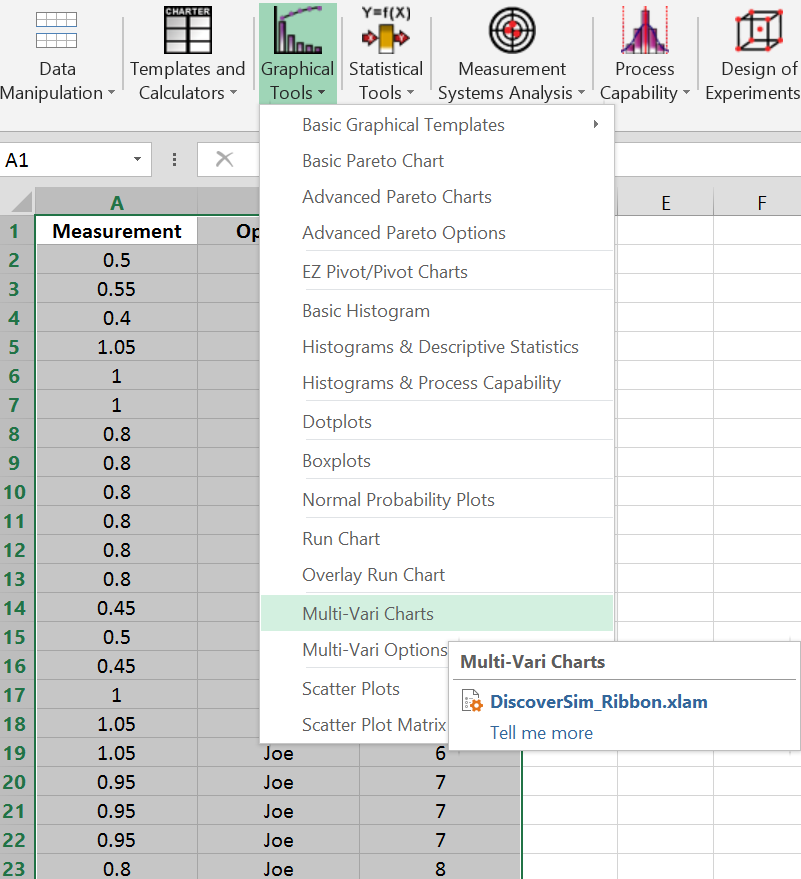
Multi-Vari Analysis Multi Vari Analysis is a graphic-driven method to analyze the effects of categorical inputs on a continuous output. It studies how the variation in the output changes across different inputs and helps us quantitatively determine the major source of variability in the output. Multi Vari charts are used to visualize the source of […]

Continue Reading
Variable Gage RR table

Variable Gage R&R with SigmaXL

Variable Gage R&R Variable Gage Repeatability & Reproducibility (Gage R&R) is a method used to analyze the variability of a measurement system by partitioning the variation of the measurements using ANOVA (Analysis of Variance). Whenever something is measured repeatedly or by different people or processes, the results of the measurements will vary. Variation comes from […]

Continue Reading