What is the Mann Whitney Test? The Mann Whitney test (also called Mann–Whitney U test or Wilcoxon rank-sum test) is a statistical hypothesis test to compare the medians of two populations that are not normally distributed. In a non-normal distribution, the median is the better representation of the center of the distribution. Null Hypothesis (H0): […]
Tag Archives | six sigma tools
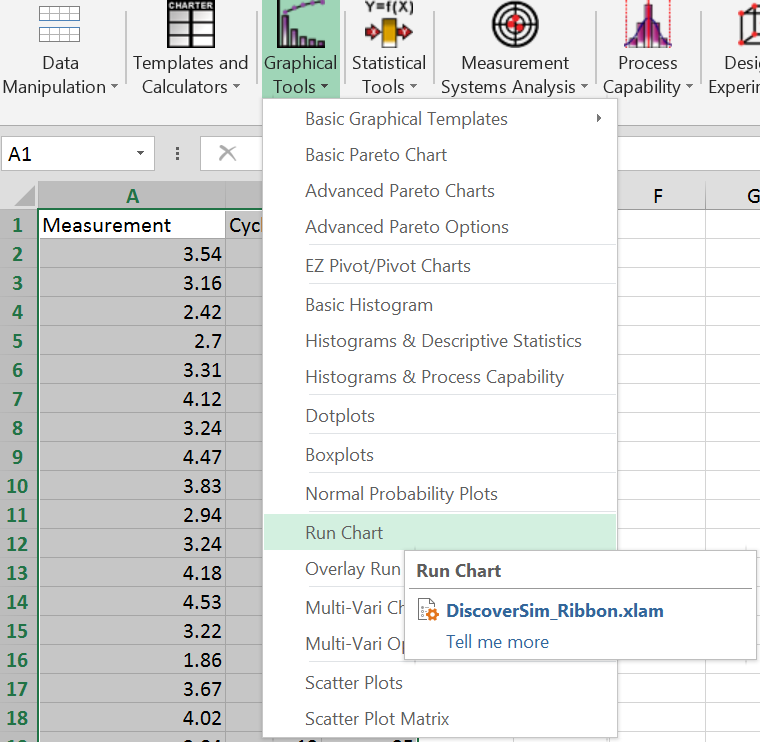
Run Chart with SigmaXL
Why we use a Run Chart A run chart is a chart used to present data in time order. These charts capture process performance over time. The X axis indicates time and the Y axis shows the observed values. A run chart is similar to a scatter plot in that it shows the relationship between X […]
Box Plot with SigmaXL
What is a Box Plot? In statistics, graphical analysis is a method to visualize the quantitative data. Graphical analysis is used to discover structure and patterns in the data. The presence of which may explain or suggest reasons for additional analysis or consideration. A complete statistical analysis includes both quantitative analysis and graphical analysis. When […]