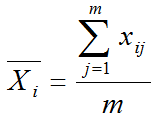
Xbar R Chart The Xbar R chart is a control chart for continuous data with a constant subgroup size between two and ten. The Xbar chart monitors the process mean and the R chart monitors the variation within subgroups. The Xbar is valid only if the R chart is in control. The underlying distribution of […]


