What is an EWMA Chart? The EWMA chart (Exponentially-Weighted Moving Average Chart) is a control chart monitoring the exponentially-weighted average of previous and present subgroup means. The more recent data get more weight than older data. It detects the shift of the process mean from the process target over time. The underlying distribution of the […]
Tag Archives | Six Sigma
CumSum Chart with Minitab
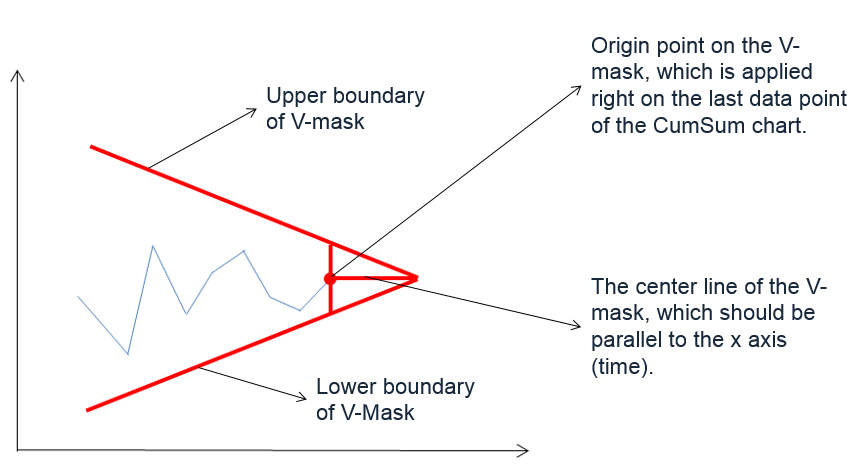
What is a CumSum Chart? The CumSum chart (also called cumulative sum control chart or CUSUM chart) is a control chart of monitoring the cumulative sum of the subgroup mean deviations from the process target. It detects the shift of the process mean from the process target over time. The underlying distribution of the CuSum […]
NP Chart with Minitab
What is a NP Chart? The NP chart is a control chart monitoring the count of defectives. It plots the number of defectives in one subgroup as a data point. The subgroup size of the NP-chart is constant. The underlying distribution of this control chart is binomial distribution. NP Chart Equations NP-chart Data Point: Center […]
Xbar S Chart with Minitab
What is a Xbar S Chart? The X-S chart (also called Xbar S chart) is a control chart for continuous data with a constant subgroup size greater than ten. The Xbar chart plots the average of a subgroup as a data point. The S chart plots the standard deviation within a subgroup as a data […]
Two Sample Proportion Test with Minitab
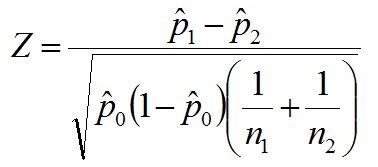
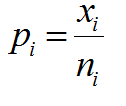
What is the Two Sample Proportion Test? The two sample proportion test is a hypothesis test to compare the proportions of one certain event occurring in two populations following the binomial distribution. Two Sample Proportion Test Assumptions How the Two Sample Proportion Test Works When np ≥ 5 and np(1 – p) ≥ 5, we […]
P Chart with Minitab
What is a P Chart? The P chart plots the percentage of defectives in one subgroup as a data point. It considers the situation when the subgroup size of inspected units is not constant. The underlying distribution of the P-chart is binomial distribution. P Chart Equations Data Point: Center Line: […]
Mann Whitney Testing with Minitab
What is the Mann Whitney Test? The Mann Whitney test (also called Mann–Whitney U test or Wilcoxon rank-sum test) is a statistical hypothesis test to compare the medians of two populations that are not normally distributed. In a non-normal distribution, the median is the better representation of the center of the distribution. Where: Mann Whitney […]
One Way ANOVA with Minitab
What is One Way ANOVA? One way ANOVA is a statistical method to compare means of two or more populations. It is a generalized form of the two sample t-test since a two sample t-test compares two population means and one-way ANOVA compares k population means where k ≥ 2. Assumptions of One Way ANOVA […]
Paired t Test with Minitab
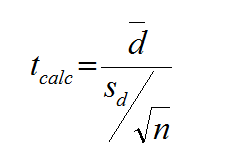
What is a Paired t Test? A Third type of a Two Sample t-Test is the Paired t Test. This test is used when the two populations are dependent of each other, so each data point from one distribution corresponds to a data point in the other distribution. When using a paired t test, the […]
Paired t Test Using SigmaXL
Paired t Test The third type of a Two Sample t-Test is the Paired t Test. This test is used when the two populations are dependent of each other, so each data point from one distribution corresponds to a data point in the other distribution. When using a paired t test, the test statistic is calculated […]
Central Limit Theorem with SigmaXL
Central Limit Theorem The Central Limit Theorem is one of the fundamental theorems of probability theory. It states a condition under which the mean of a large number of independent and identically-distributed random variables, each of which has a finite mean and variance, would be approximately normally distributed. Let us assume Y1, Y2 . . […]