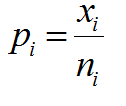
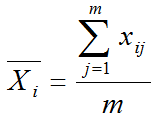
What is a P Chart? The P chart plots the percentage of defectives in one subgroup as a data point. It considers the situation when the subgroup size of inspected units is not constant. The underlying distribution of the P-chart is binomial distribution. P Chart Equations Data Point: Center Line: […]


