This content is for Subscribers Users.
Archive | “How to” with Minitab
CumSum Chart with Minitab
This content is for Subscribers Users.
NP Chart with Minitab
This content is for Subscribers Users.
Xbar S Chart with Minitab
This content is for Subscribers Users.
Two Sample Proportion Test with Minitab
This content is for Subscribers Users.
P Chart with Minitab
This content is for Subscribers Users.
U Chart with Minitab
This content is for Subscribers Users.
Xbar R Chart with Minitab
This content is for Subscribers Users.
IR Chart with Minitab
This content is for Subscribers Users.
Fractional Factorial Designs with Minitab
This content is for Subscribers Users.
Stepwise Regression in Minitab
What is Stepwise Regression? Stepwise regression is a statistical method to automatically select regression models with the best sets of predictive variables from a large set of potential variables. There are different statistical methods used in stepwise regression to evaluate the potential variables in the model: Three Approaches to Stepwise Regression How to Use Minitab […]
Full Factorial with Minitab
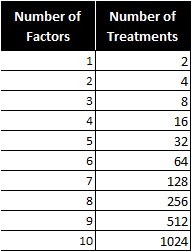
What is a Full Factorial DOE? In a full factorial experiment, all of the possible combinations of factors and levels are created and tested. For example, for two-level design (i.e.each factor has two levels) with k factors, there are 2k possible scenarios or treatments. Two factors, each with two levels, we have 22 = 4 treatments […]
Logistic Regression with Minitab
What is Logistic Regression? Logistic regression is a statistical method to predict the probability of an event occurring by fitting the data to a logistic curve using logistic function. The regression analysis used for predicting the outcome of a categorical dependent variable, based on one or more predictor variables. The logistic function used to model […]
Chi Square Tests with Minitab
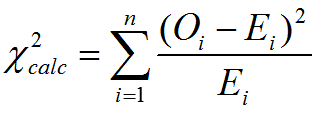
This content is for Subscribers Users.
Run Chart with Minitab
Why we use a Run Chart A run chart is a chart used to present data in time order. These charts capture process performance over time. The X axis indicates time and the Y axis shows the observed values. A run chart is similar to a scatter plot in that it shows the relationship between X and […]
Box Cox Transformation with Minitab
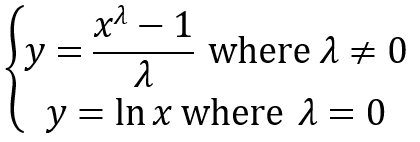
This content is for Subscribers Users.
Multiple Linear Regression with Minitab
This content is for Subscribers Users.
Simple Linear Regression with Minitab
This content is for Subscribers Users.
Correlation Coefficient with Minitab
This content is for Subscribers Users.
One Sample Wilcoxon Test with Minitab
This content is for Subscribers Users.