Top Nav

Tag Archives | Minitab

EWMA EQ2

EWMA Chart with Minitab

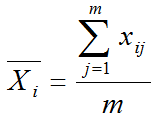
What is an EWMA Chart? The EWMA chart (Exponentially-Weighted Moving Average Chart) is a control chart monitoring the exponentially-weighted average of previous and present subgroup means. The more recent data get more weight than older data. It detects the shift of the process mean from the process target over time. The underlying distribution of the […]

Continue Reading
CumSum JMP_1.0

CumSum Chart with Minitab

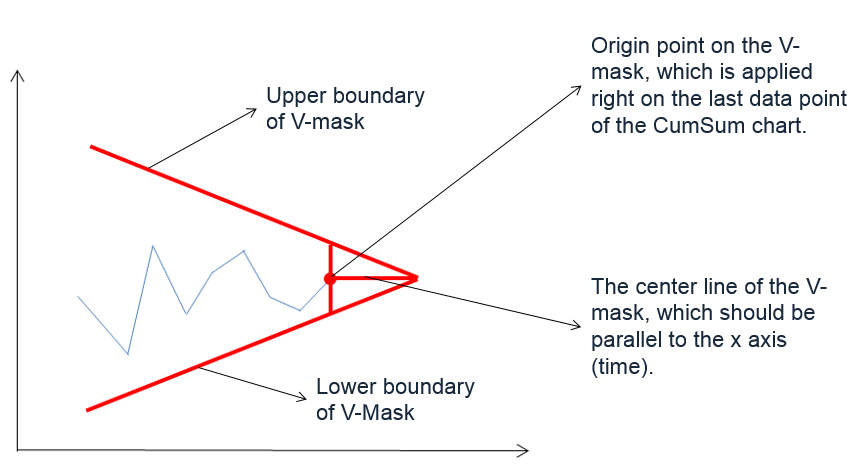
What is a CumSum Chart? The CumSum chart (also called cumulative sum control chart or CUSUM chart) is a control chart of monitoring the cumulative sum of the subgroup mean deviations from the process target. It detects the shift of the process mean from the process target over time. The underlying distribution of the CuSum […]

Continue Reading
NP Chart EQ1

NP Chart with Minitab

What is a NP Chart? The NP chart is a control chart monitoring the count of defectives. It plots the number of defectives in one subgroup as a data point. The subgroup size of the NP-chart is constant. The underlying distribution of this control chart is binomial distribution. NP Chart Equations NP-chart Data Point: Center […]

Continue Reading
P Chart EQ1

P Chart with Minitab

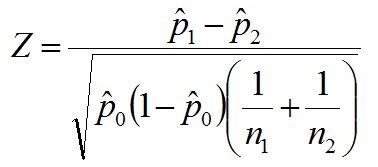
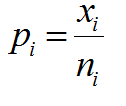
What is a P Chart? The P chart plots the percentage of defectives in one subgroup as a data point. It considers the situation when the subgroup size of inspected units is not constant. The underlying distribution of the P-chart is binomial distribution. P Chart Equations Data Point:         Center Line:   […]

Continue Reading
U Chart EQ1

U Chart with Minitab

What is a U Chart? The U chart is a type of control chart used to monitor discrete (count) data where the sample size is greater than one, typically the average number of defects per unit. Defect vs. Defective Remember the difference between defect and defective? A defect of a unit is the unit’s characteristic […]

Continue Reading
Full Factorial EQ1

Full Factorial with Minitab

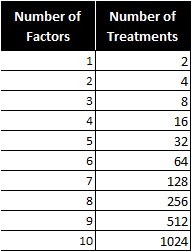
What is a Full Factorial DOE? In a full factorial experiment, all of the possible combinations of factors and levels are created and tested. For example, for two-level design (i.e.each factor has two levels) with k factors, there are 2k possible scenarios or treatments. Two factors, each with two levels, we have 22 = 4 treatments […]

Continue Reading
LGR2

Logistic Regression with Minitab

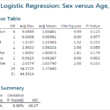
What is Logistic Regression? Logistic regression is a statistical method to predict the probability of an event occurring by fitting the data to a logistic curve using logistic function. The regression analysis used for predicting the outcome of a categorical dependent variable, based on one or more predictor variables. The logistic function used to model […]

Continue Reading
Multiple Linear Regression EQ1

Multiple Linear Regression with Minitab

What is Multiple Linear Regression? Multiple linear regression is a statistical technique to model the relationship between one dependent variable and two or more independent variables by fitting the data set into a linear equation. The difference between simple linear regression and multiple linear regression: Multiple Linear Regression Equation Where: Both dependent and independent variables […]

Continue Reading
Simple Linear Regression EQ1

Simple Linear Regression with Minitab

What is Simple Linear Regression? Simple linear regression is a statistical technique to fit a straight line through the data points. It models the quantitative relationship between two variables. It is simple because only one predictor variable is involved. It describes how one variable changes according to the change of another variable. Both variables need […]

Continue Reading
Correlation Coefficient MTB_1.0

Correlation Coefficient with Minitab

Pearson’s Correlation Coefficient Pearson’s correlation coefficient is also called Pearson’s r or coefficient of correlation and Pearson’s product moment correlation coefficient (r), where r is a statistic measuring the linear relationship between two variables. What is Correlation? Correlation is a statistical technique that describes whether and how strongly two or more variables are related. Correlation […]

Continue Reading